Changes to signmaking methodology
Background
Since I retired a few years ago I have not done much work in the Signmaking area, but recently I have been creating some covers for various pieces of machinery (sewing machines, Casio Keyboard and my Mimaki CG-60st cutter/plotter) and I wanted to pretty them up a bit as they live in various living and workshop areas of the house. I needed a specific font for my Singer sewing machine cover, which was only available in OpenType format, but my version of CorelDraw 12 does not allow OpenType fonts.
In fact CorelDraw 12 is really quite out of date, but it is the only software I have that will use Mimaki FineCut plotting software, which runs the CG-60st. Both these items of software are 32 bit, so upgrading is an expensive and/or impossible task. Later versions of Corel don’t recognise Mimaki Fine Cut, and I can’t find a later copy of Finecut.
I bought my plotter in 2009, and it was made in about 2002, and I am rather fond of it. I always wanted to be able to use Inkscape to create my designs on either Windows or Linux, but outputting to the plotter directly is not a good option apparently.
So searching around for solutions to my problems, I found an application called Switchblade, by Joerg Beigang, on github, which looked like a possible solution. It is a very simple app that opens very simple SVG files created on Inkscape (or other drawing software) converts the paths to HPGL and sends the HPGL to the plotter. It can scale a cut, or rotate it through 90 degrees but not much else. It makes no use of the extra capabilities of the Mimaki CG series plotters, or of the Mimaki extensions to HPGL called MGL-IIc, so has some over complex code which is not always appropriate when dealing with Mimaki plotters.
Switchblade is written in Python and the source is accessible for reuse and modification, and it can run on Windows or Linux. I started off simple with my changes, improving the rotate function, adding a mirror function, correcting some of the coding which uses trigonometry for transformations when it is not required, but went onto to add some other simple functions available in Mimaki Finecut. The result is an application which only works on Mimaki plotters, but uses some of the special features only available on them.
Set up and usage
In the zip file or tar file below are some instructions on how to create an executable from the source files. This is not my area of expertise, so good luck finding out how to install Python if you aren’t an expert either!
Hardware
The first thing you should do is set up your plotter if it is not already set up. Use a usb to serial adapter to connect your computer to the plotter, assuming you don’t have a serial port to use. Treat yourself to a modern one, my 16 year old one was not a lot of use.
Setup your plotter to 9600 baud, 8 bits, parity: None, stop bit: 1 handshake: hard. Insert a sheet of media, and a pen or a blade, and set up a tool or two on the plotter control panel, with appropriate speed, pressure and knife offset values, using the Sample Cut option. When you are happy you can use the plotter, select a tool from the control panel, and put the plotter into remote mode.
Create an SVG
Prepare a simple SVG for trial purposes. Make sure everything in your SVG is a path—no text or other primitives. Use the convert to path or curves function on fonts and ellipses , circles etc. Break text apart, ungroup everything, and regroup into a single object. Export an SVG rather than save it, and use the selected items only option for just the items you want to plot.
Plotter Settings
Start the software, and use the Plotter Settings button, and set the step size to 0.025mm unless your plotter is one of the very rare ones that uses 0.010mm step size. Change the port to match the port shown in Device Manager for your serial adapter, and set the baud to 9600.
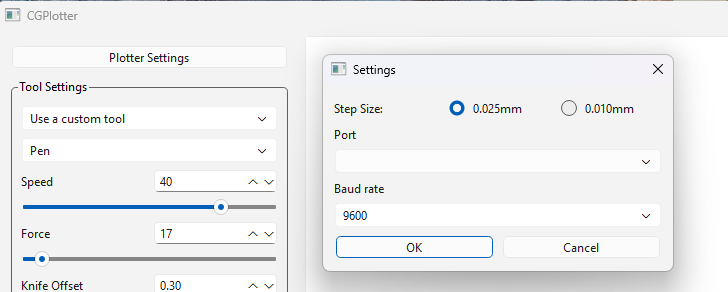
Loading a drawing
Open the SVG you prepared earlier, and the drawing should appear in the main window. The dimensions of the drawing will appear in the Stats box. If you loaded a sheet of media and put the plotter in remote mode, the width of the plotter sheet will appear in the Stats box too. If not, when you load the sheet, press the Sheet button to get the width. The Sheet button is activated when a drawing has been opened, and the Plot button when the width of the sheet is known.
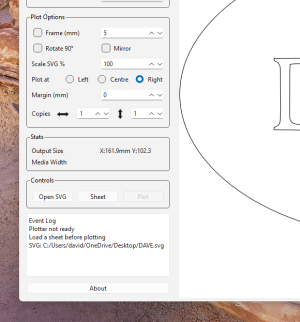
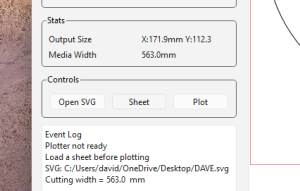
At this point, if you press the plot button, the plotter should attempt to plot your drawing. I recommend using a roll of paper and a pen rather than a cutter to do most of your setting up and testing, much cheaper than vinyl!
The event log shows notable events that have been performed, and occasionally useful information about what may have gone wrong, so in the example just above, it shows that the SVG was loaded before the sheet was loaded, and then that the sheet was loaded and the width was taken from the plotter.
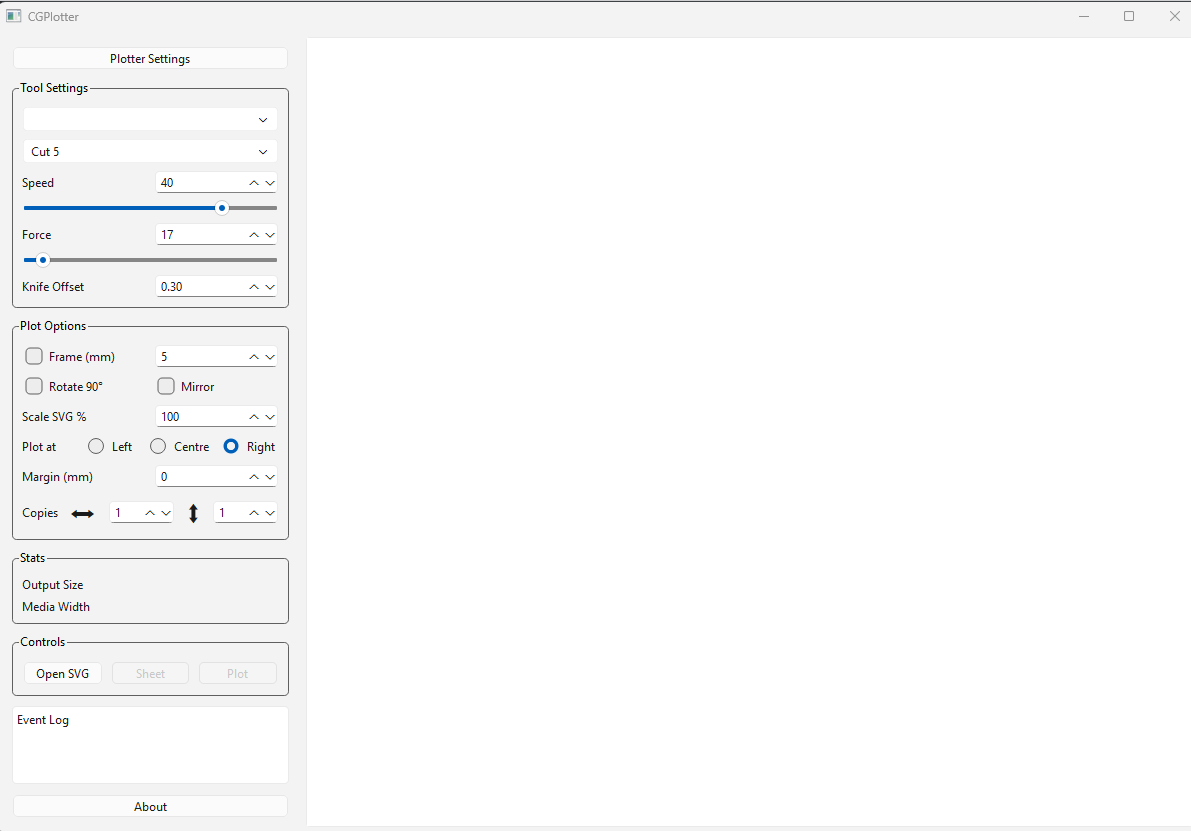
Tool settings
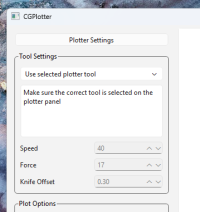
Now the fun parts. A feature of the Mimaki plotters is to set up tool profiles actually on the plotter. There are 6 available, Pen and Cut 1 through Cut 5. This is more than enough for basic sign making work, and once set up can be used by selecting them on the control panel This makes getting the settings much easier, using the square cut and sample cut options in the set up menu. The first option in the tool settings box is to choose to use the selected plotter tool. This greys out all the tool settings, and plots directly to the plotter using the plotter condition.
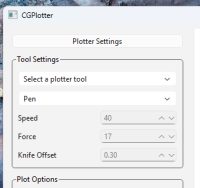
The second option is to select a plotter tool from the drop down that is set up on the plotter, one of Pen, Cut 1, Cut 2 through to Cut 5. Again the tool settings are greyed out, and the drawing is sent the plotter with instructions to override the plotter condition with the selected tool.
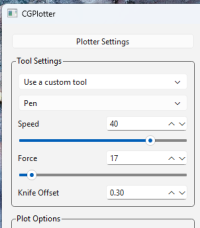
Finally the third option is to use a custom tool. If this is selected the tool settings are not greyed out and can be changed to values to suit the materials and blade you are using. If any values are set to zero, the plotter will use the settings for the tool selected in the drop down, and will temporarily overwrite the tool settings on the plotter with the values entered. This will persist until another the tool button on the control panel is pressed. My tip – if using a custom setting set all three values up, and if using a pen use the Pen tool in the drop down.
Plot options
More fun parts!
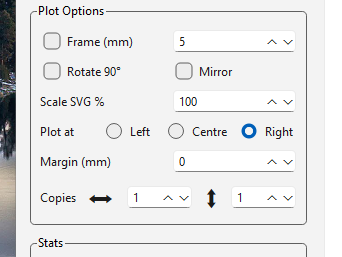
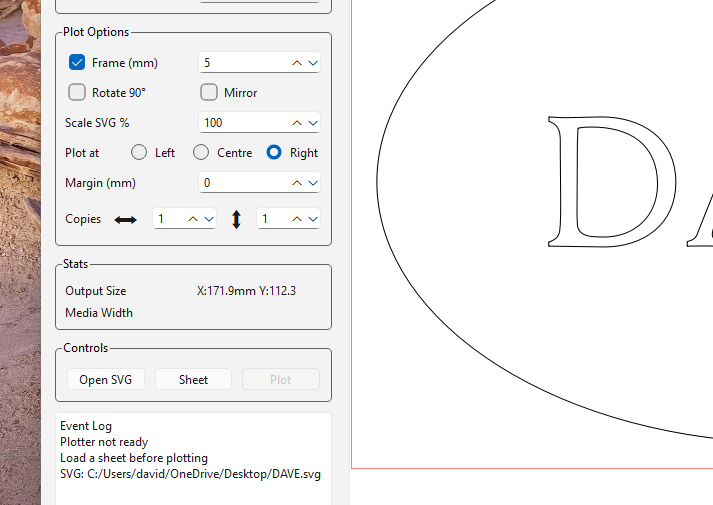
Adding a frame, and specifying the frame size. When this is selected, you can see the results on the main screen, and the size of the drawing changes in the stats box. The frame becomes part of the drawing until it is removed – see scaling below. The frame line is shown in red.
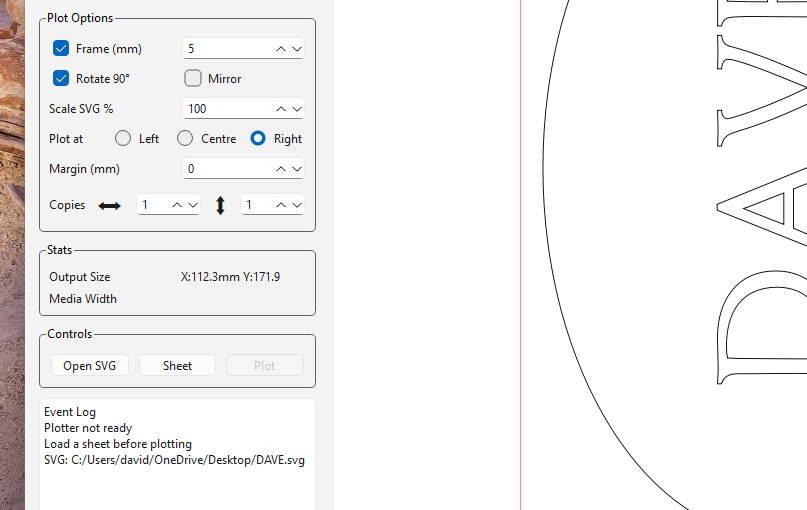
Rotate 90 degrees toggles the rotation of the drawing, 90 degrees anticlockwise first press, 90 degrees clockwise second press. The results can be seen on the main screen, the frame rotates with it, and the size in the stats box shows the new orientation.
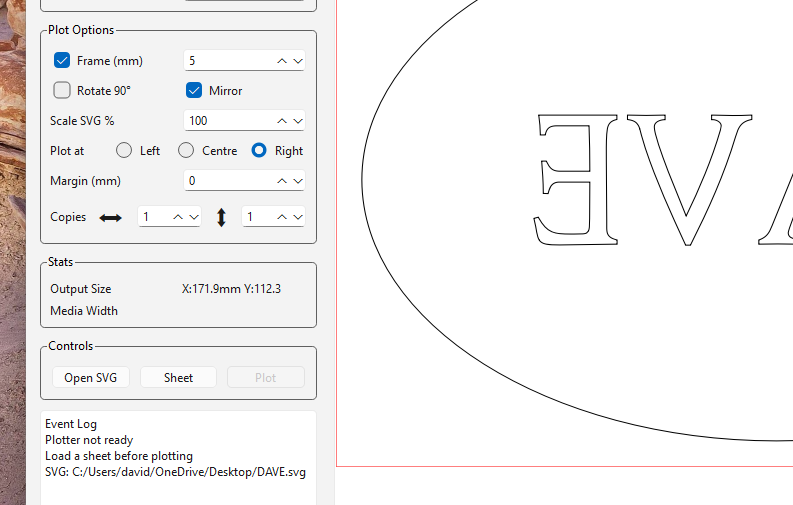
Mirror flips the drawing around the vertical access with each press, so normally will toggle between normal and mirrored. However rotate 90 degrees and mirror don’t change what each other has done, so results can be unexpected if you press mirror, rotate, mirror, rotate or similar. Have a play, it’s fun!
Scale changes the drawing to a percentage of its original size, so 50% halves the x and y dimensions, and 200% doubles the x and y dimensions etc. At this point the frame from the first option is part of the drawing, so increasing or reducing the scale of the drawing also affects the frame – it stays in proportion with the drawing.
Plot position is normally at bottom right of the plotting area, the 0,0 origin is in the bottom right corner. The Left option allows the drawing to be drawn from the bottom left of the plotting area, and Centre puts the drawing in the centre of the plotting area. Great for getting the most out of a sheet of vinyl.
Margin puts an empty space around the drawing while plotting it. This is equal on each side, top and bottom, and is outside any frame added. It is not in proportion with the drawing size, so a 10mm margin will be 10 mm regardless of scaling on the drawing and frame. Great for multiple copies or offsetting a plot from the edge of a sheet.
Multiple copies of the drawing (including frame and margin) can be lined up across the width of the page, starting at bottom right. If the total width of the drawing ( and frame and margin) multiplied by the number of copies is more than width of the sheet, an error message will be shown and plotting will stop. The spin box after the double ended horizontal arrow controls this option.
The spin box after the vertical double ended arrows allows for multiple rows of drawings to be plotted. The length of the lines does not affect this option. However, as there is no knowledge of the amount of media available on the plotter, when it runs out of paper or vinyl plotting will continue until the remote button is pressed or the plot finishes, possibly damaging the cutting strip in the plotter. Be very careful of media length and size of plots.
The screen prints above show the GUI based on Joerg’s version, but it may get a rework some time in the future.
TAR version of cgplotter
ZIP version of cgplotter